Neural Net convergence plots with pySkyNet
Using pySkyNet is trivial to create convergence plots of the trained neural network for either regression of classification. For plotting we recommend the seaborn library . Although it will work with matplotlib. The values are kept for each iteration_print_frequency for which the default value is 50.
Here is an example on how to obtain the convergence plots:
Setup:
from sklearn.datasets import load_boston
from sklearn.util import shuffle
from SkyNet import SkyNetRegressor

# X are the features and y are the targets
# shuffle returns a random permutation
X,y = shuffle(load_boston().data,load_boston().target)

X_train = X[0:200]
y_train = y[0:200]

X_valid = X[200:400]
y_valid = y[200:400]

sn_reg = SkyNetRegressor(id = 'identification_reg', n_jobs = 1,
                         activation=(3, 3, 3, 0), layers = (10, 10, 10),
                         max_iter=200, iteration_print_frequency=1)

sn_reg.fit(X_train,y_train,X_valid,y_valid)
Error squared as function of steps:
sn_reg.error_dataframe.plot()

Correlation as a function of steps:
sn_reg.corr_dataframe.plot()

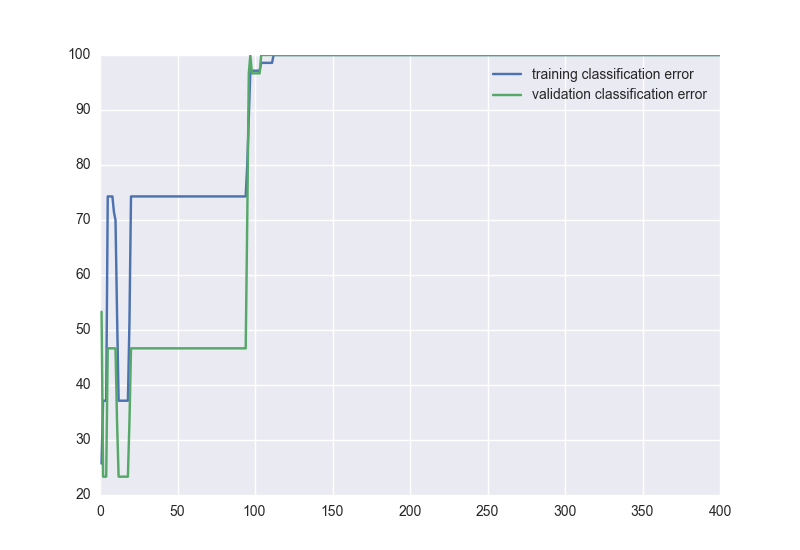
When SkyNetClassifier is called, you can plot also plot the misclassification rate as a function of steps.
sn_cla.class_dataframe.plot()